













A new diagnostic method that scores data valuation robustness for cleaning, efficient training, and fair partner compensation.
This Research Card introduces a new way to measure how trustworthy data valuation really is, by checking how much rankings of “most valuable data” change when the performance metric changes. Using a geometric representation of data contributions, the method gives Criteo a robustness score that tells us whether we can confidently use data valuation for cleaning, efficient training, or fair partner compensation. It’s essentially a diagnostic test that makes data valuation reliable and actionable for internal optimization and external data collaboration.
- Title: On the Impact of the Utility in Semivalue-based Data Valuation
- Authors: Mélissa Tamine, Benjamin Heymann, Patrick Loiseau, Maxime Vono
- Team: R&D — CAIL — AI Foundations — Performance Science
- Revue: ICLR 2026
- Status: Accepted
- Category: Interpretability and explainable AI
Why did we work on this topic?
The main difficulty is that data valuation depends heavily on the utility function, i.e., the metric used to measure model performance (accuracy, log-loss, AUC, F1, etc.). In practice, we observe that the value assigned to the same data can change significantly when the metric changes: a point that is highly valuable for improving accuracy may be far less valuable (or even detrimental) for log-loss.
This creates a trust and usability issue in two common situations. First, for a given task, several metrics can be legitimate, and if the ranking of data points changes completely between metrics, the valuation results become hard to interpret and may appear arbitrary. Same conclusion when the metric is a trade-off among multiple criteria, and if small changes in the trade-off weights yield a totally different top or least valuable subset.
Our central question was therefore: how robust are data valuation results to the choice of performance metric, and can we provide practitioners with a diagnostic that tells them whether a valuation can be trusted?
What did we achieve?
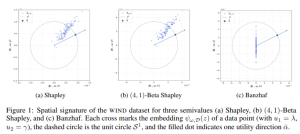
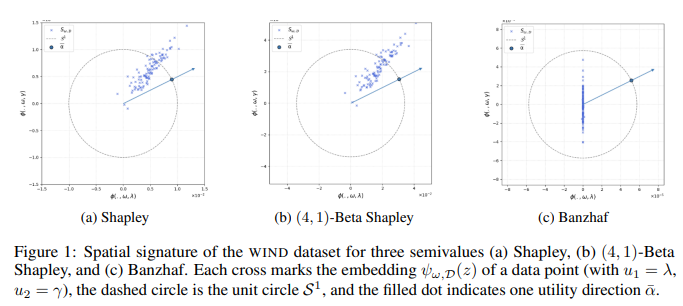
We developed a practical methodology that quantifies robustness to metric choice. Concretely, we introduce a geometric framework that represents each data unit as a vector in a low-dimensional space, yielding a spatial signature of the data pool that makes utility dependence interpretable.
Building on this representation, we define a robustness metric that ranges from 0 to 1 and summarizes how stable the ranking remains when the performance metric changes. A robustness score close to 1 indicates the ranking is largely insensitive to metric choice (high stability), while a score close to 0 indicates that small changes in the metric can substantially reshuffle the ordering (low stability).
We validated our approach across multiple public datasets and demonstrated that the score aligns with intuitive and standard notions of ranking stability.
How did we proceed?
The key mathematical property we exploit is the linearity of the valuation methods we study (semivalues). Informally, this means that if a performance metric (utility) can be expressed as a combination of simpler base components, then the value of a data point for that metric is the same combination of its values for those components. This leads to a clear geometric picture. We represent each data unit as a vector in an n-dimensional space, where n is the number of base components describing the family of utilities. Each coordinate corresponds to the contribution of a data unit to a base component, resulting in an embedding (spatial signature) of the dataset in that n-dimensional space. Choosing a specific utility corresponds to selecting a direction in that space (a weight vector over the base components): the value of each data unit under that utility is its projection onto this direction, and the ranking is obtained by sorting these projections. Changing the metric means moving (or rotating) in this direction, and robustness becomes a question of how far the utility direction must change before the induced ranking changes significantly. Our robustness metric formalizes this idea by measuring, on average, the utility change needed to trigger a given level of ranking disruption.
What is the originality here?
The main originality is a shift in perspective. Most prior work emphasizes how to define data values and compute them efficiently, while we focus on a question practitioners immediately face: should we trust the resulting ranking, or is it mostly an artifact of the metric choice?
Our geometric approach makes this question tangible by framing robustness as an interpretable notion of stability under metric rotation, thereby providing practical guidance. Ultimately, our contribution is a diagnostic test for data valuation: before using values for data cleaning, subset selection, or partner compensation, it tells you whether the ranking is reliable or highly metric-dependent.
Check all our research cards 👇
https://medium.com/criteo-engineering/research-cards/home