













Engineering

Importance of Graceful Shutdown in Kubernetes
Have you ever deployed a new version of your app in Kubernetes and noticed errors briefly spiking during rollout? Many teams do not even realize this is happening, especially if they are not closely monitoring their error rates during deployments. There is a common misconception in the Kubernetes world that bothers me. The official Kubernetes…

Enhancing Service Reliability with Feature-Based SLOs: A Comprehensive Approach
In recent years, our focus has been on defining Service Level Objectives (SLOs) for HTTP API endpoints. While this approach has proven beneficial for development teams, it has also had less impact on external customers and product teams. Users typically expect SLOs to be associated with features rather than individual endpoints or services. Communicating the…

BigDataFlow: Continuous Delivery of data pipelines
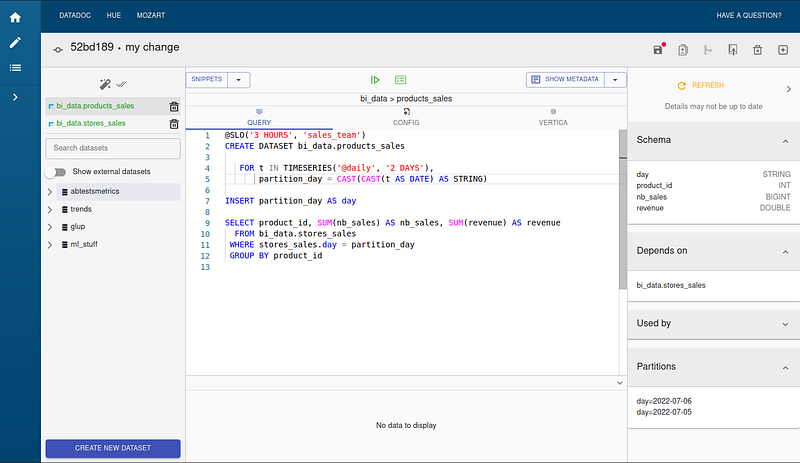
A new article in the Criteo DevXDays series. You can find all the articles about Developer Experience at Criteo here. Data at Criteo is a core asset and the source of reports we provide to both audiences, external and internal. We are talking about a massive amount of data daily and need a proper workflow…

Monitoring microservices — Central Monitoring: A tool for a global view of things
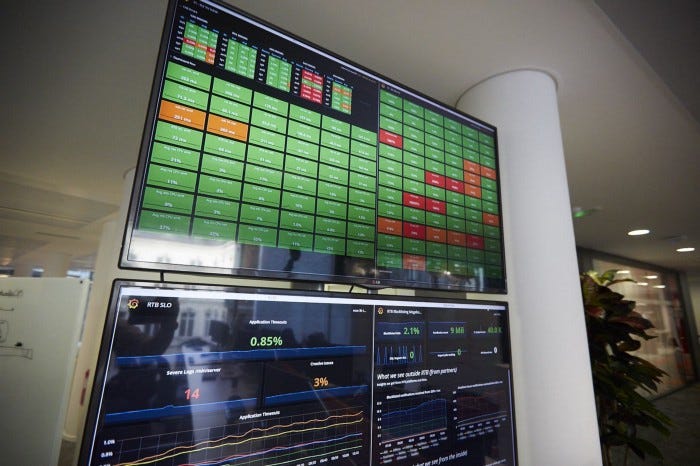
A bit of history Some years ago, Criteo switched from monolithic applications to microservices. With this new architecture comes challenges like monitoring hundreds of applications, all interacting with each other. At Criteo, there are several ways to introduce innovation. One of them is the yearly Hackathon! At the 2020 event, the fantastic Firewatch team aimed to…

Scheduling Data Pipelines at Criteo — Part 3
The Proven Model in Production Building a successful Platform is a quest of the good abstraction level. If you’ve missed it, check out the previous articles in this series: Scheduling Data Pipelines at Criteo — Part 2 This week we deep dive into the key ideas leveraged by BigDataFlow medium.com Scheduling Data Pipelines at Criteo — Part 1 Introducing…

Scheduling Data Pipelines at Criteo — Part 2
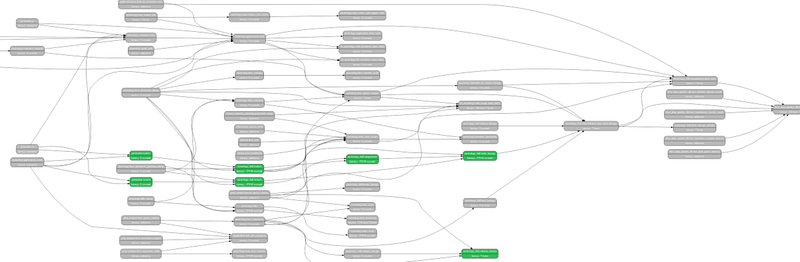
The key ideas leveraged by BigDataFlow Bringing database query planner inside Workflow Management Systems Going back to the goal we introduced in Part 1 for our data pipeline platform: Users should only write the task How does the project infer statically ? the type of inputs and outputs the DAG of tasks The first idea leveraged…

Scheduling Data Pipelines at Criteo — Part 1
Introducing Criteo’s BigDataFlow project Data @ Criteo Data is a core asset for Criteo as it feeds our ML engine, it is the source of the reports that we provide to our clients and it is explored internally to gain insights.Every interaction of our clients with the Criteo platform is logged and all this data is…